 |
| Thickness Values |
Upon completion of this lesson you will be able to:
The hypsometric equation tells us that the thickness of a pressure layer is proportional to the mean temperature of that layer. This theoretical results has been used over the years to derive an empirical relationship between the thickness of various pressure layers and the occurrence of rain, snow, and freezing precipitation. By empirical we mean that the relationship was derived from correlations among observational data.
The sections that follow summarize four specific studies that relate precipitation type to thickness. Although not a perfect discriminatior between rain-snow, thickness is a very useful method for locating the rain-snow line. The relationships shown on this web page are based on statistical relationships among observed data. Nevertheless, these relationships can be applied to model output to determine future locations of the rain-snow line.
A first approximation to the location of the rain-snow line can be made using temperature data at the 850 mb and 700 mb level. The table below lists this approximation:
| Pressure Level | Discriminator | Precip Type |
| 850 MB | < 0°C | snow |
| > 0°C | rain | |
| 700 MB | < -6°C | snow |
| > -6°C | rain |
This method does not involve thickness, but gives a good first guess to the location the rain-snow line. Its major shortcoming is that it looks only a data from one level and does not consider the vertical temperature distribution which is important to determining precipitation type.
During the 1960s Hank's developed a rain-snow relationship based upon the 1000-700 mb thickness. He found that the 2840 m thickness line effectively separated liquid precipitation from snow associated with a surface air temperature of 32°F or below 85 percent of the time.
He also found that these discriminator values varied with elevation. Specifically:
| Elevation | Discriminator |
| < 1000 ft | 2840 m |
| 2000 ft | 2850 m |
| 3000 ft | 2860 m |
Essentially, as the elevation increase, the critical thickness value for rain versus snow also increases.
The table below lists the rain-snow relationships for several layers, including those determined by Hanks:
| Pressure Layer | Mainly Snow | 50 percent | Mainly Rain |
| 850-500 mb | 4050 m | ||
| 850-700 mb | 1520 m | 1540 m | 1555 m |
| 1000-500 mb | 5360 m | 5400 m | 5490 m |
| 1000-700 mb | 2800 m | 2840 m | 2870 m |
| 1000-850 mb | 1300 m | 1325 m |
In applying these values to your forecast, remember that if thickness values are less than the number in the "mainly snow"column, snow is the likely precipitation type. If thickness values are greater than the number in the "mainly rain" column, rain is the likely precipitation type. For the most likely location of the rain-snow line, use the values in the "50 percent"column.
As mentioned in the Hank's discussion above, there is some variation of these values with elevation. For example, across Kansas, the 5400 m thickness value works well over eastern Kansas while a thickness value of 5460 m is better over northwest Kansas (3000-4000 ft elevation). If you are forecasting for a specific area, there are likely local forecasting rules that tell you what works best in your area.
Freezing rain and sleet (ice pellets) require the presence of a warmer than freezing layer above the colder than freezing layer near the earth's surface. Thickness can be used to approximate this warm-over-cold requirement. Specifically, you can represent the warm layer with the 850-700 mb thickness and the cold layer with the 1000-850 mb thickness. The table below shows that relative values that can be used to forecast freezing precipitation.
| Layer | Thickness Values | |||
| 850-700 mb | < 1540 m | 1540-1555 m | > 1555 m | > 1555 m |
| 1000-850 mb | < 1300 m | < 1300 m | < 1300 m | > 1300 m |
| Surface Temp | < 32°F | < 32°F | ||
| Precip Type | snow | frzg precip | frzg precip | rain |
This method does not distinguish between freezing rain and sleet, but combines them into a generic term, freezing precipitation. When using this table, combine the values of the 850-700 mb thickness, the 1000-850 mb thickness, and the surface temperature to determine the type of precipitation.
 |
| Thickness Values |
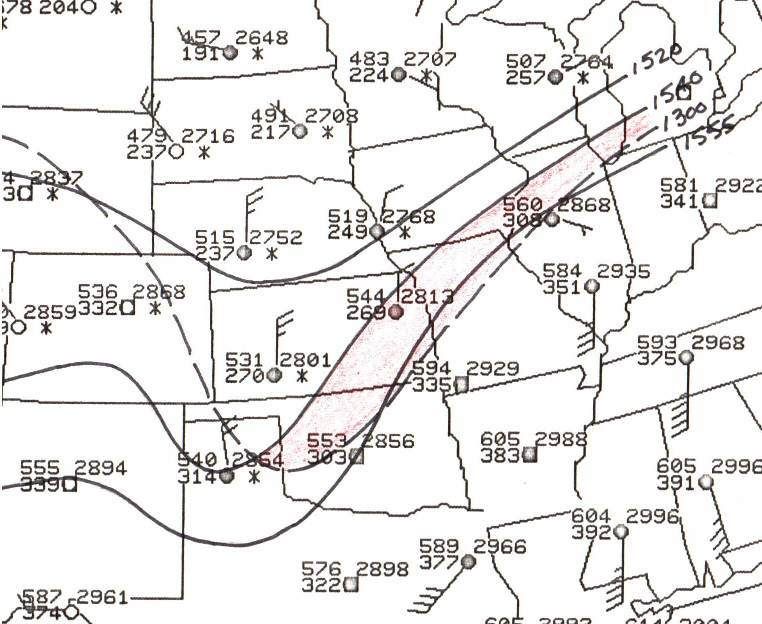
The plot above shows several thickness values for each radiosonde station. The upper left value is for the 850-700 mb layer; the lower left values is for the 1000-850 mb layer; and the upper right value is for the 1000-700 mb layer. Thickness contours for the 1520 m, 1540 m and 1555 m for the 850-700 mb layer and 1300 m for the 1000-850 mb layer are drawn on the chart. This chart can be used to apply the technique outlined in the last section.
Looking at the chart, you can see an area from western Oklahoma, through southeastern Kansas, across northern Missouri, into northern Illinois where the 1000-850 mb thickness is less than 1300 m and the 850-700 mb thickness is greater than 1540 m. This is a prime area for freezing precipitation according to the above technique.
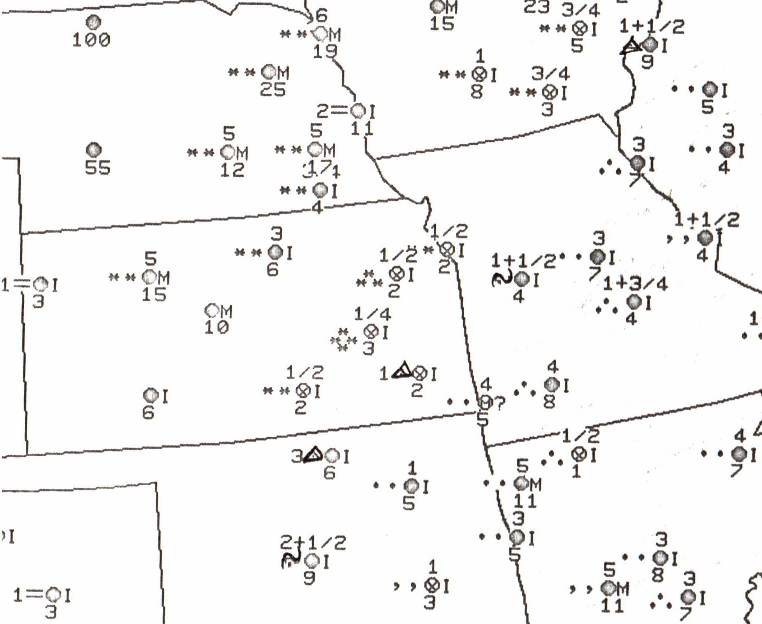
The corresponding surface observations are shown in the chart below. You can see a relatively narrow band of freezing rain and sleet (ice pellets) along the same line as the area outlined in the thickness chart.
 |
| Surface Observations |
Where is the 2840 m contour for the 1000-700 mb layer located relative to the precipitation type?
Thickness values have been used for decades for determining precipitation type and are a very effective approach to this winter forecast challenge. The 1000-500 mb thickness was readily available in the past and has been a main focus of thickness application. With the availability of gridded data sets in today's operational evnironment, you now have the ability to look at any or all of the layer thicknesses listed above.
One last thing to remember: you need moisture and lift to produce precipitation. Thickness values just provide a clue to the precipitation type, not the occurrence of the precipitation.
Instructions: Place the cursor over the answer of your choice. If you are correct, it will be highlighted in green; if you are incorrect, it will be highlighted in red.
Precipitation is expected to occur in your forecast area. The 850 mb temperature will cool from 5oC to -5oC during the precipitation event. What type of precipitation would you forecast?
Which of the following thickness values can be used to define the location of the rain-snow line?
If the 850-700 mb thickness is 1550 m, and the 1000-850 mb thickness is 1280 m, and the surface temperature is 30oF, what type of precipitatiopn is likely?