Weather Forecasting ... On-Line
Standardized Anomaly Trends at Topeka
Changes in the 11-Year Running Mean of Standardized Anomaly at Topeka, Kansas
Original 11-Year Running Mean of Standardized Anomaly (data through 2010)
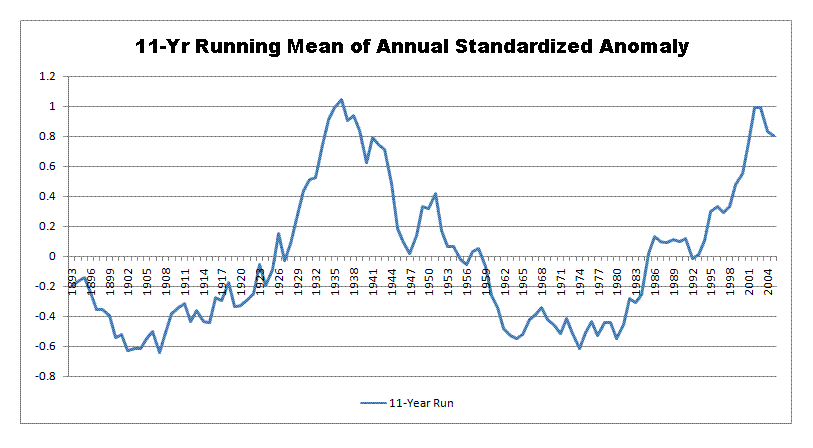 Original Figure 2 from "Temperature Trends at Topeka, Kansas" (2011).
Updated 11-Year Running Mean of Standardized Anomaly (data through 2019)
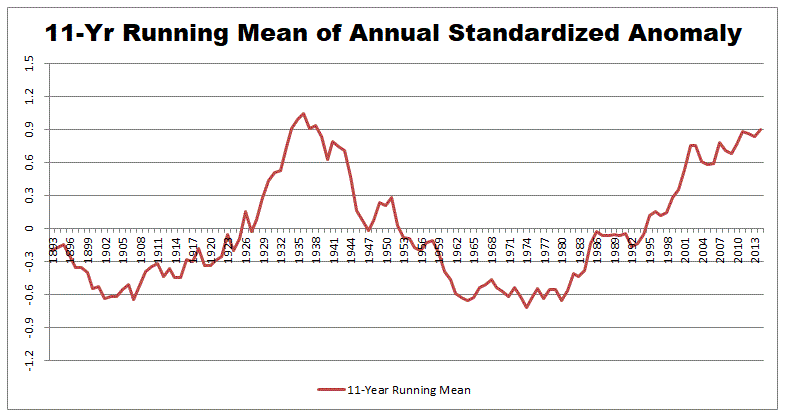 Updated Figure 2 for data through 2019.
The chart traces should be the same prior to 1948. After 1948 minor variations are possible due to the method used to calculate the standardized anomaly. See original paper for details on the method used.
Return to the Research Projects page
last updated on 3/20/2020