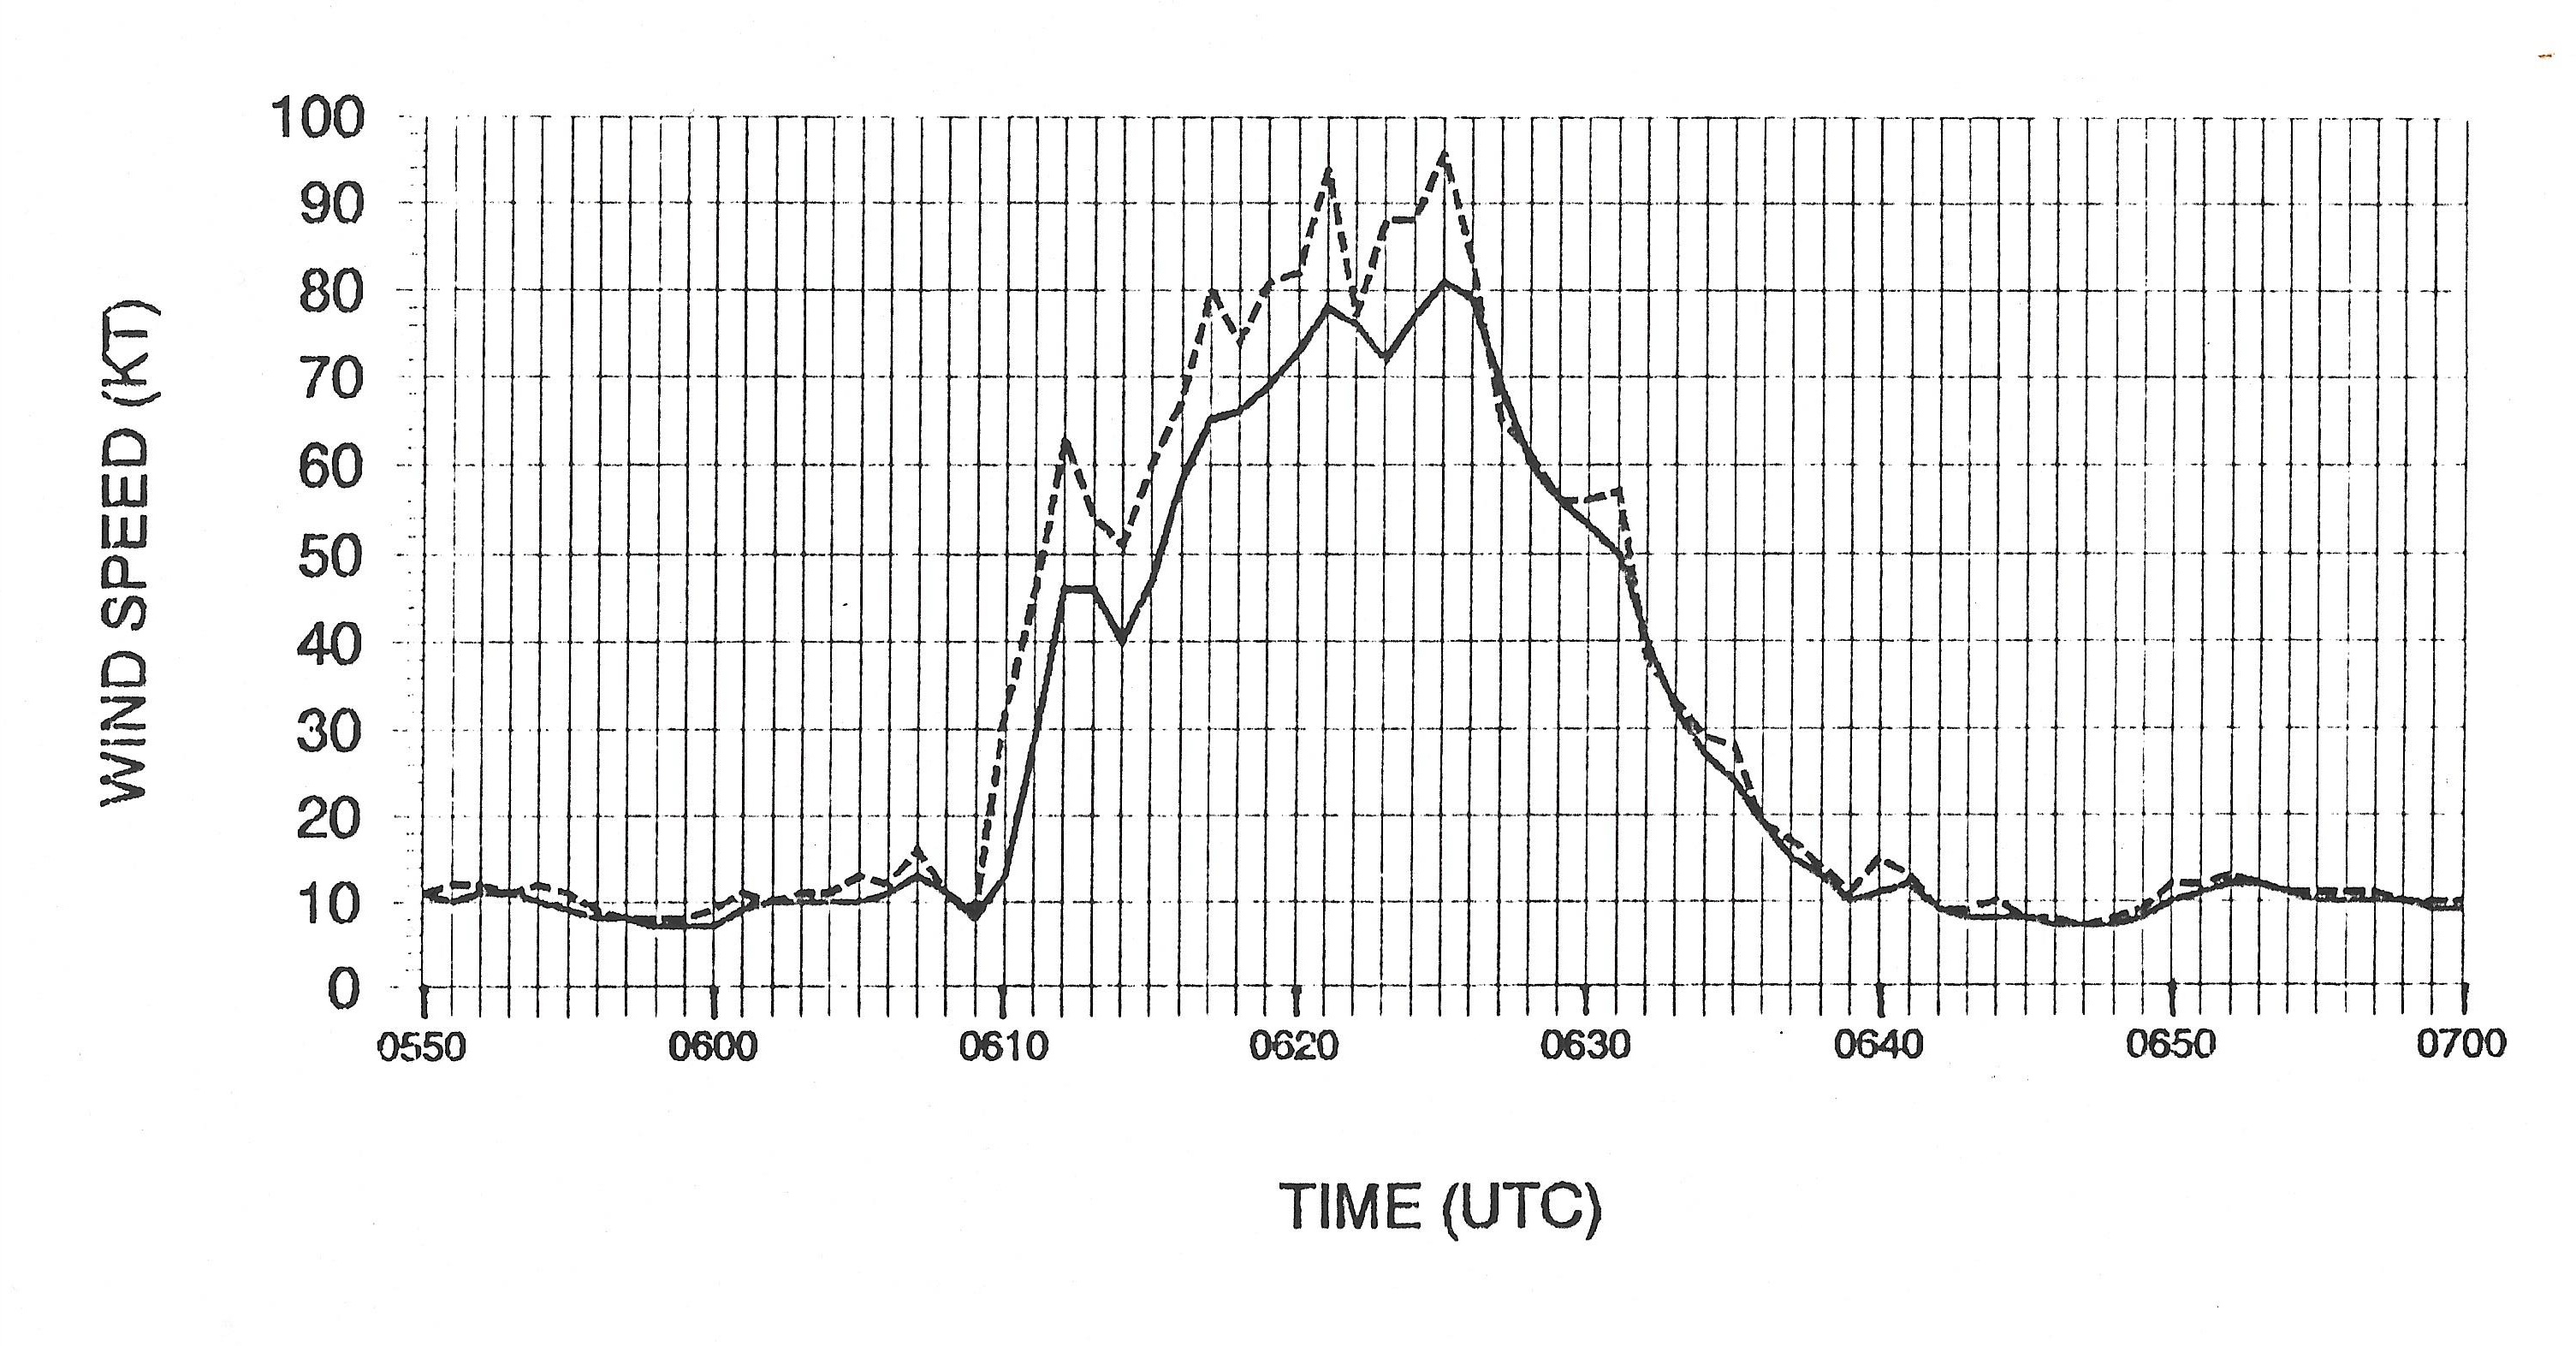
Figure 1: ASOS wind speed data for 08 July 1992 from 0550 UTC to 0700 UTC.
Solid line is the average 2-minute wind speed (in knots).
Dashed line is the maximum 5-second average wind speed for each minute (in knots).
Surface weather observations across the United States are taken by the Automated Surface Observing System (ASOS). This system provivdes a complete weather observation each minute and transmits these observations once each hour and whenever special weather criteria are met. The ability to produce 1-minute data allows the system to capture a wide variety of mesoscale detail for a wide variety of weather systems. On 08 July 1992 the ASOS at Concordia, Kansas, observed a wet-microburst. The purpose of this web page is to document the details of this event as seen by ASOS.
The structure of a thunderstorm consists of an updraft and a downdraft. This structure has been described many times in the meteorological literature and introductory textbooks (and will not be repeated here). For strong thunderstorms the downdraft is frequently called a downburst to reflect the intensity of the winds. The Glossary of Meteorology (Glickman, 2000) defines a downburst as "an area of strong, often damaging winds produced by a convective downdraft over an area from less than 1 to 10 km in horizontal extent." A more concentrated downburst is called a microburst and defined as "a downburst that covers an area less than 4 km along a side with peak wind that last 2 to 5 minutes." The term wet microburst indicates that downburst winds were accompanied by heavy rainfall during the period of strongst winds.
Figure 1 shows the onset of strong winds at 0610 UTC. Within two minutes the average 2-minute wind increased to 46 knots, dropped off very briefly, before continuing upward to a average 2-minute wind speed of 81 knots at 0625 UTC. The maximum 5-second wind speed represents the gustiness of the winds. These values, shown by the dashed line, increased along with the average wind speed. The 5-second wind reached 94 knots at 0621 UTC and peaked at 96 knots at 0625 UTC. Within 14 minutes after the peak, winds returned to pre-storm levels around 10 knots. This brief increase in wind speed is common with the outflow from intense thunderstorms.
The definition of microburst given above says that the strongest winds last from 2 to 5 minutes in duration. Figure 1 shows that winds greater than 50 knots occurred between 0615 UTC and 0631 UTC. This is much longer than the 2 to 5 minute defintion. However, does this time period apply to the entire period of strong winds or periods of shorter durations associated with surges within the broader downburst? Examination of Figure 1 shows surge peaks at 0612, 0621 and 0625 UTC, and perhaps around 0617 UTC. Based on these surges, the term "microburst" is used to describe this event.
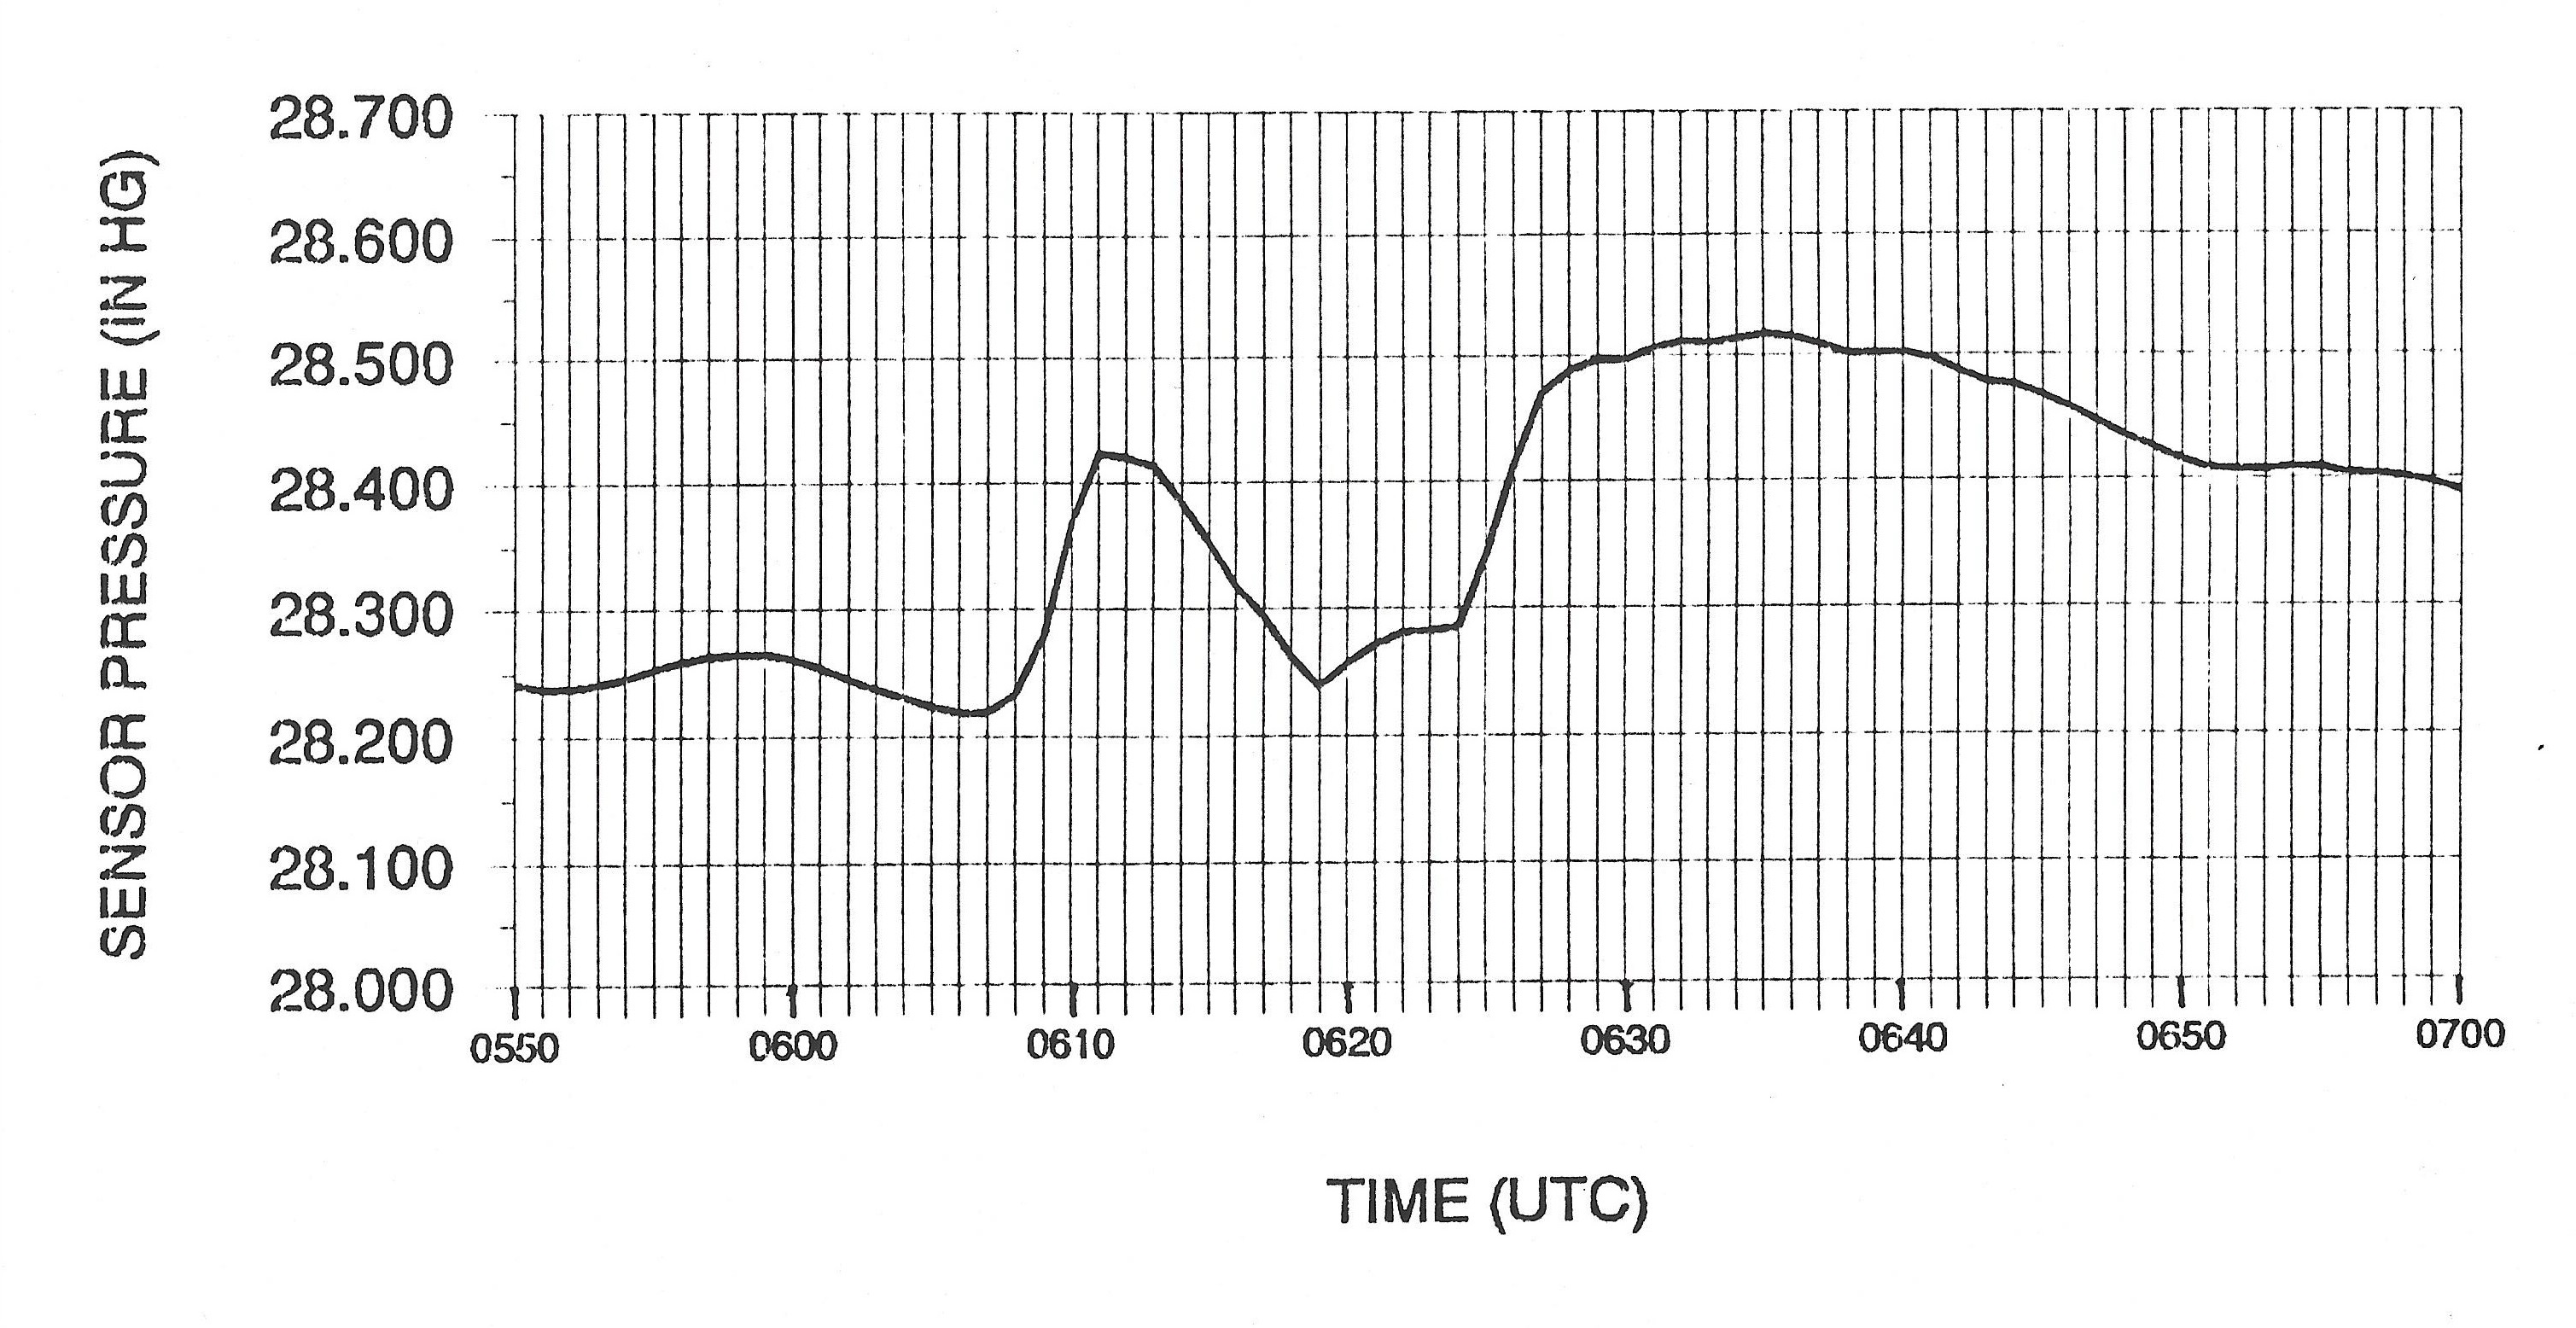
Figure 2 is a time series of sensor pressure data during the wet microburst event. At 0608 UTC, two minutes prior to the wind surge, the sensor pressure started to rise. Detailed studies by Charba (1974), Goff (1976) and Wakimoto (1982) observed a similar pressure increase relative to the initial wind surge and temperature drop associated with thunderstorm outflows. The pressure increase peaked about 0.2 inch HG above pre-storm levels before dropping. This initial drop is followed by a slow increase for about 6 minutes before a second sharp rise occurs around 0624 UTC. Charba (1974) also observed a double pressure rise in his study.
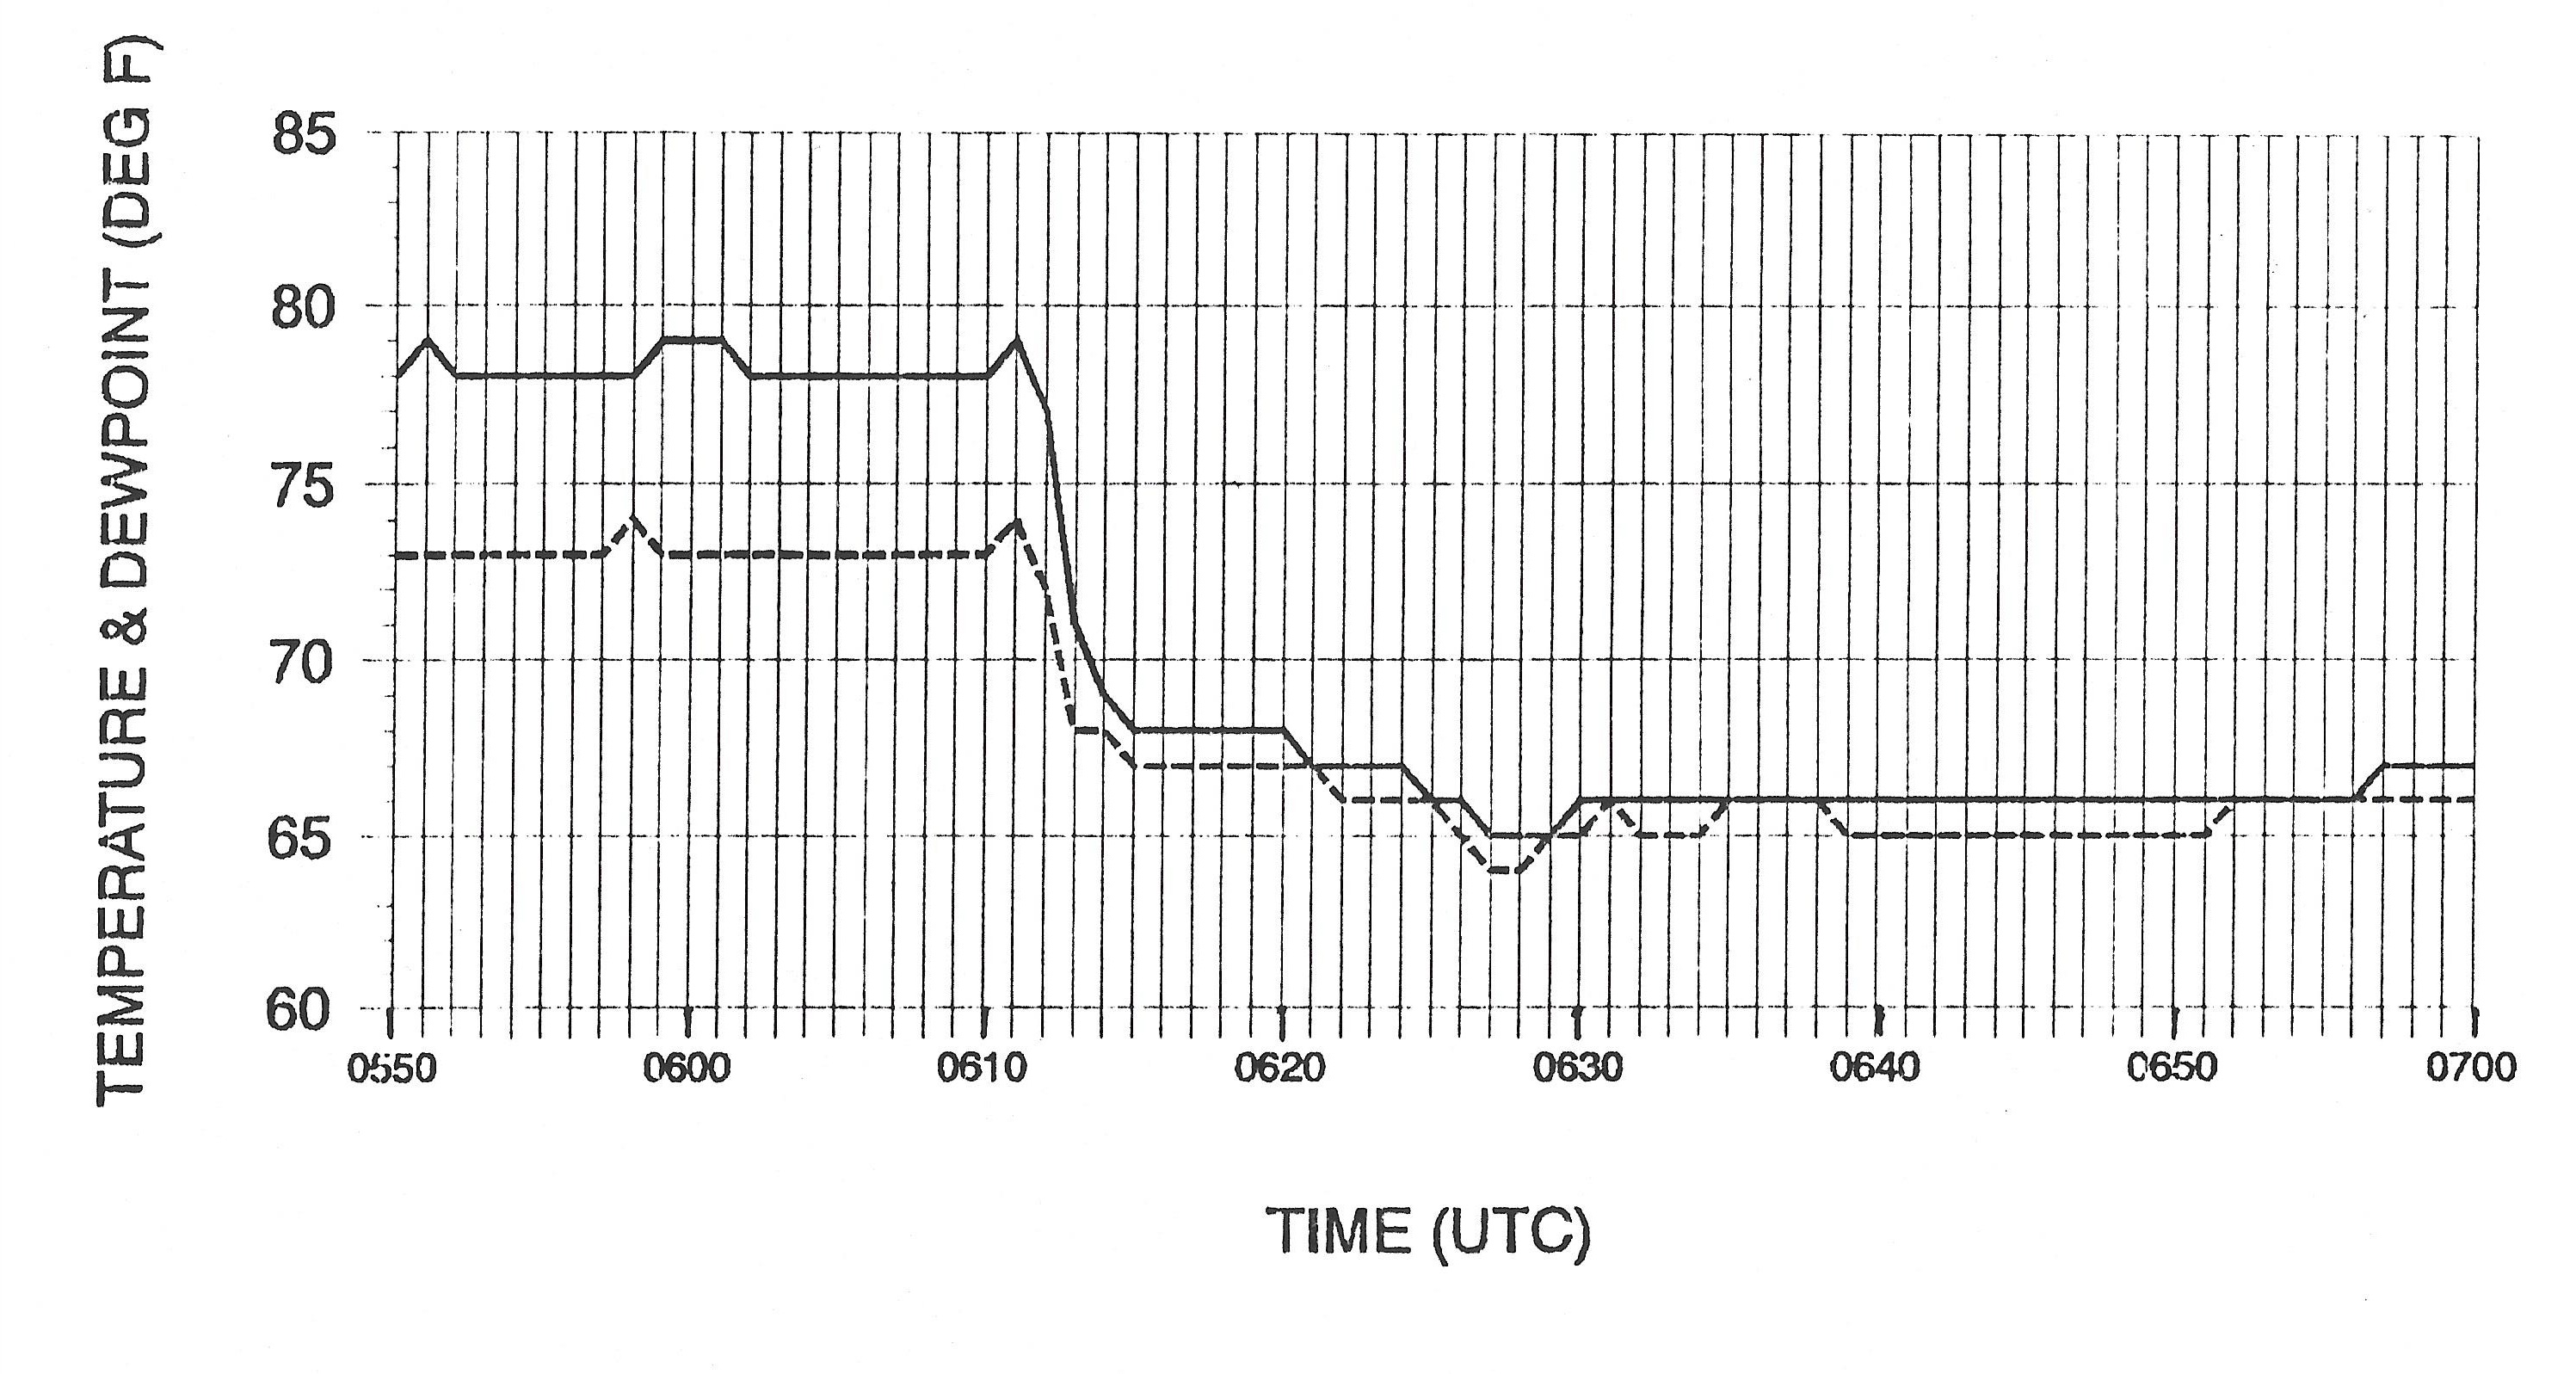
Average 1-minute temperature and dew point value are shown in Figure 3. Both readings start to fall at 0612 UTC coincident with the initial wind increase and two minutes after the initial pressure rise. The temperature drops 11 degrees F in about 3 minutes. There appears to be a second, more subtle, drop during the period of maximum wind and pressure rise between 0620 and 0630 UTC.
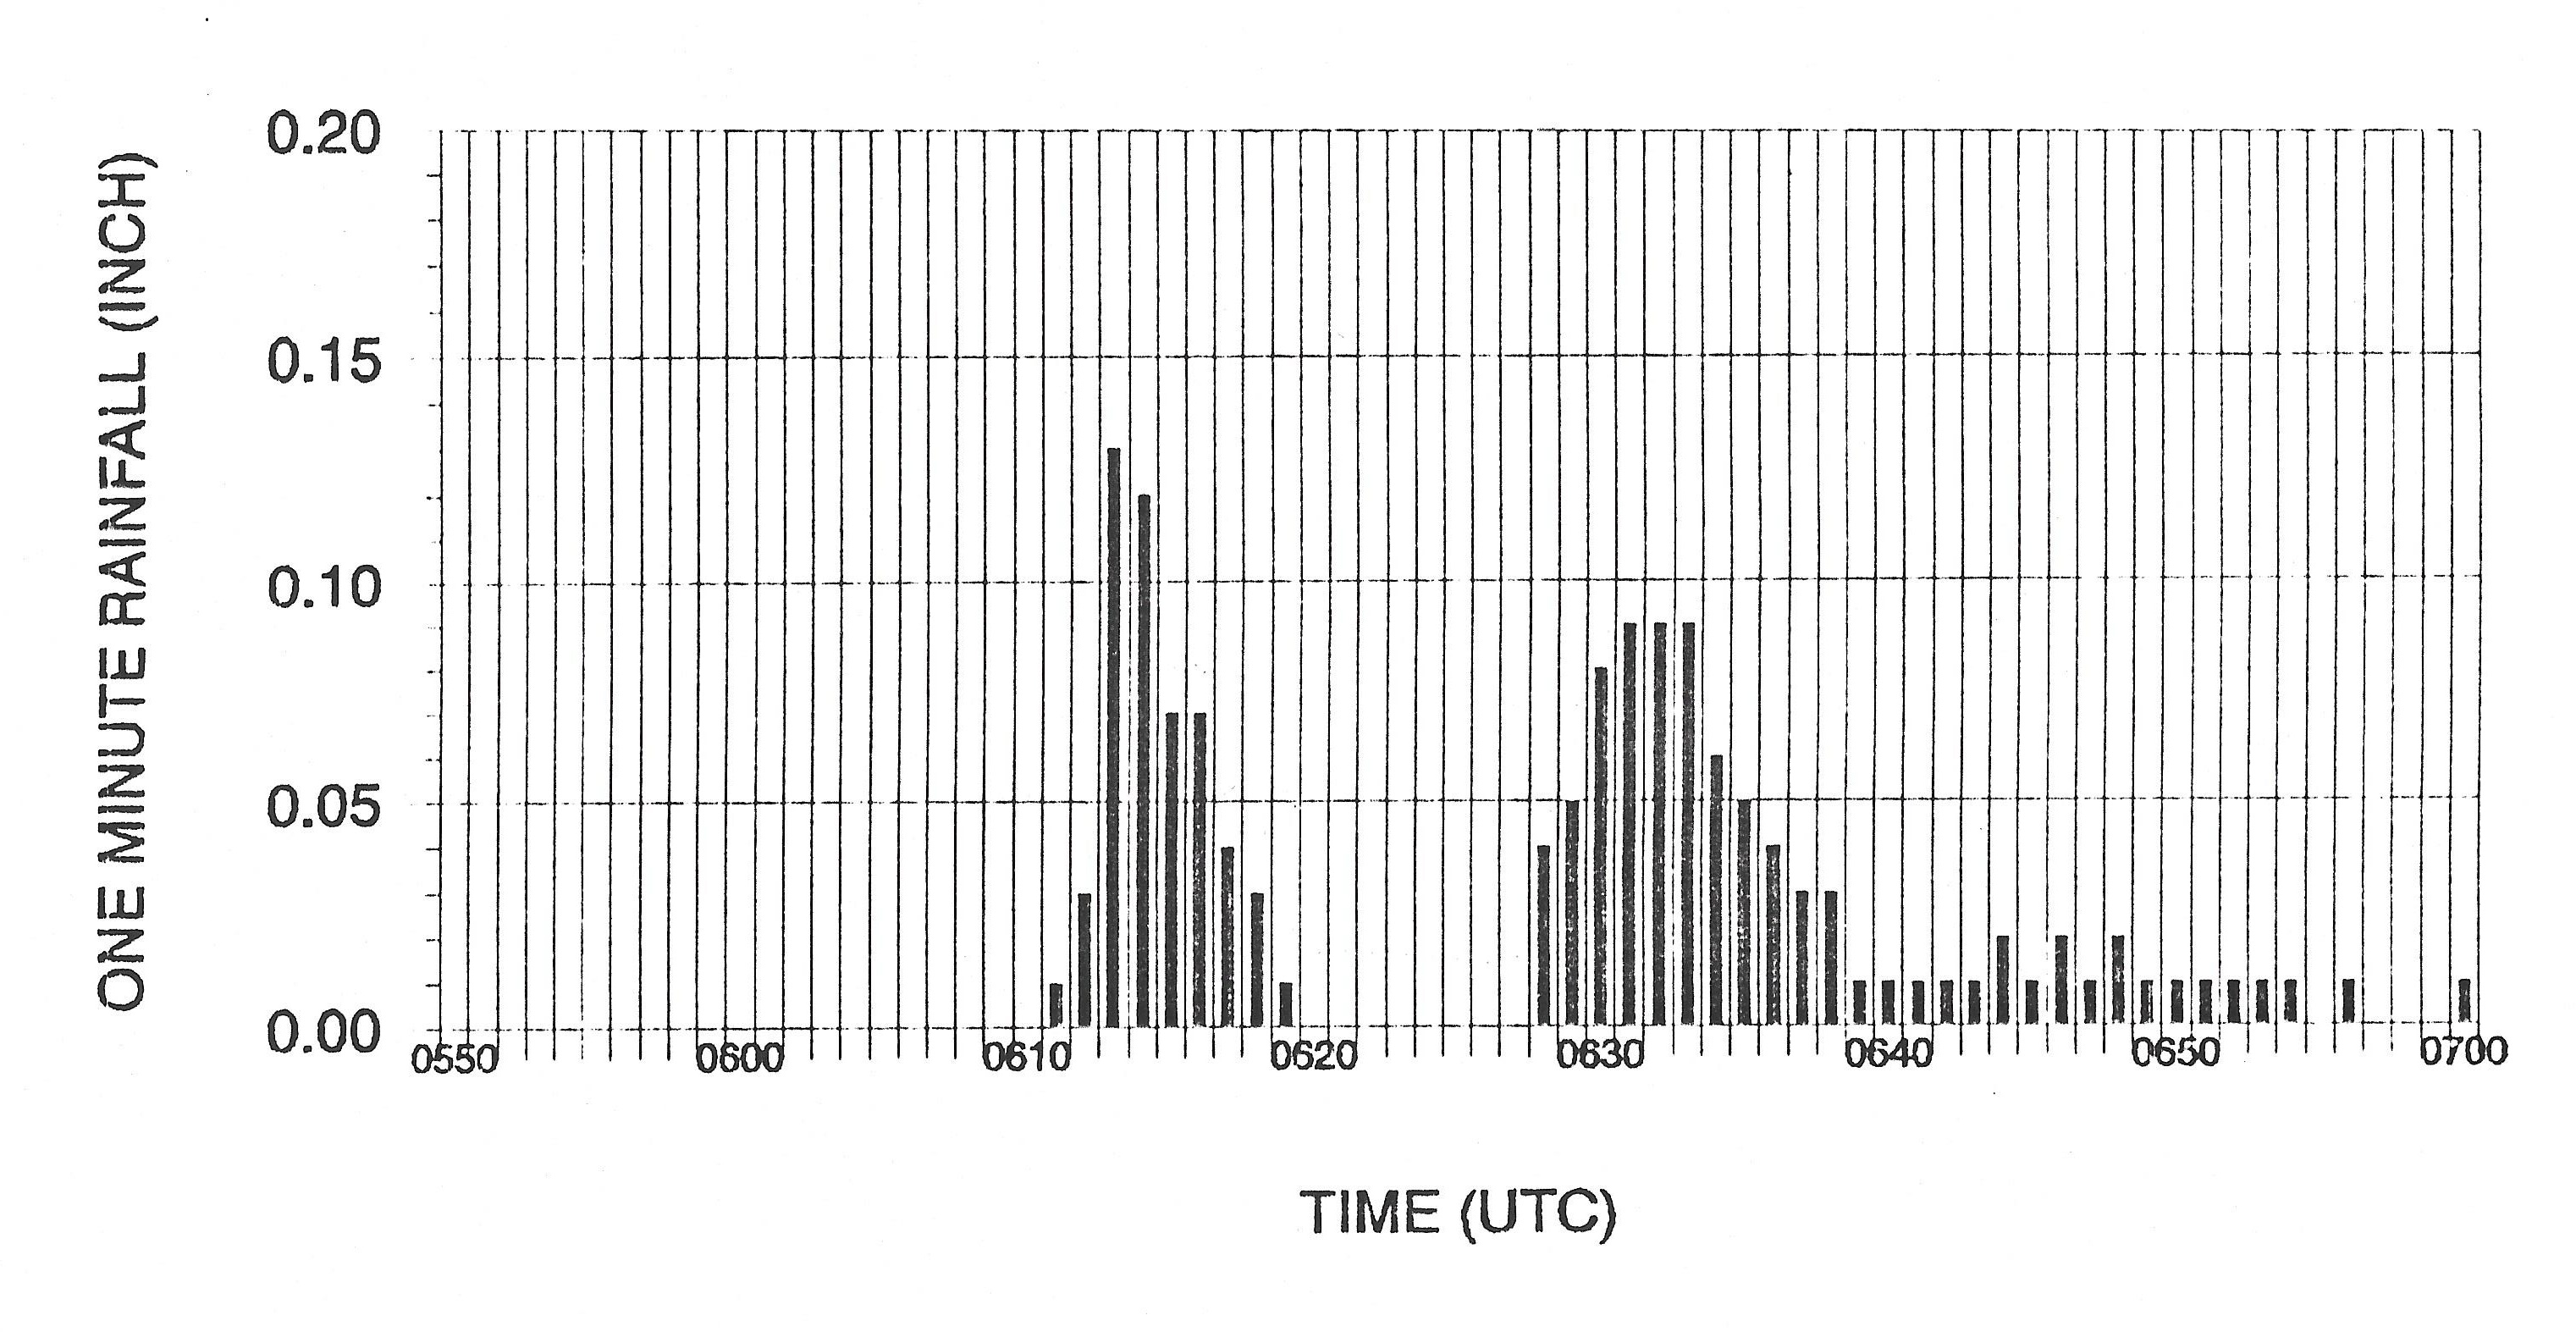
The 1-minute precipitation amounts from the ASOS tipping bucket raingauge are shown in Figure 4. The first 0.01 inch of rainfall is measured at 0611 UTC, a minute after the initial increase in wind speed. Rainfall continues until after the stronger part of the thunderstorm has passed.
Figure 4 shows that no rainfall was mesaured from 0620 to 0627 UTC. During this period all of the 2-minute average wind speeds were 69 knots or greater. This raises the question: If the wind speed is above a certain level, does the rain blow over the top of the raingauge and miss being measured? This is likely what happended during this event. If it is assummed that at least 0.10 inch of rainfall occurs each minute from 0615 to 0630 UTC, total rainfall was underestimated by approximately 1 1/4 inch.
Even thoug the ASOS tipping bucket is equipped with an Alter wind shield to help reduce wind effects on rainfall measurement, rainfall was apparently missed. This type of loss is not unique to ASOS but occurs with any of the current gauges used to measure rainfall (Linsley et al, 1982).
Data presented on this we page shows the typical changes in wind speed, wind gusts, atmospheric pressure, temperature, and dew point during the ocurrence of a thunderstorm. The strong intensity documented here will not be seen in all thunderstorms but is limited to more intense events, and varies from storm to storm. Frequently the rainfall occurs after the strong outflow winds in which case the term "wet" is omitted from the description of the event. In a relatively rare event, dry downdrafts have been known to increase the temperature instead of decreasing it. These events are known as "heat bursts" and are decribed in the Useful Weather Information section of this web site.
Charba, J., 1974: Application of gravity current model to analysis of squall-line gust fronts. Monthly Weather Review, 102, 140-156.
Glickman, Todd S., editor, 2000: Glosaary of Meteorology, 2nd edition. American Meteorological Society, Boston, 885 pp.
Goff, R.C., 1976: Vertical structure of thunderstorm outflows. Monthly Weather Review, 104, 11, 1429-1440.
Linsley, R.K., M.A. Kohler, and J.L.H. Paulhus, 1982: Hydrology for Engineers, 3rd edition. McGraw-Hill, New York, 508 pp.
Wakimoto, R.H., 1982: The lifecycle of thunderstorm gust fronts as viewed with Doppler radar and rawinsonde data. Monthly Weather Review, 110, 8, 1060-1082.
Data used in this analysis was provided by the National Weather Service.