
Fig 1: Schematic of a Radar Beam and the Energy Returned by Precipitation.
With the proliferation of radar imagery on the Internet and television/cable, it is important that non-meteorologists (and even some so-called "television meteorologists") have an idea of what a radar senses and displays. The purpose of this web page is to provide some basic background information to help non-meteorologists understand what is shown on radar displays. Detailed interpretation of these displays can be complex and is beyond the scope of this web page.
The word, RADAR, is an acronym that stands for RAdio Detection And Ranging. The term was officially coined during World War II (1939-1941) even though the concept of radar was discovered and demonstrated prior to the war. The development and use of radar expanded tremendously during the war when weather was seen as unwanted "noise" that interferred with the radar's primary purpose, the detection of aircraft and ships. After the war surplus radars helped spur research efforts to apply radar technology to weather detection. This led to operational weather radar in the early 1950s.
Weather radar is essentially a radio transmitter that sends out a pulse of energy that interacts with the precipitation in the atmosphere. Most radars use a parabolic dish to focus the energy along a narrow beam. The beam is nominally 1 degree in width. This energy travels at the speed of light and has a wavelength around 10 cm. (Some local weather radars operate with a 5 cm wavelength.) When the radar beam is aimed horizontally, the atmosphere bends the beam upward relative to the Earth's surface. This phenomenom is referred to as beam refraction. By the time the radar beam is 150 miles away from the radar site, it is sampling the atmosphere 10 to 12 thousand feet about the Earth's surface.
A weather radar does not continuously transmit energy. It sends out a pulse of energy for a very short period of time, typically from 1 to 4 microseconds, and then listens for that energy to return to the antenna. In fact, a weather radar listens for a considerably longer time period than it transmits. As the energy travels away from the radar, it is reflected off precipitation. Only a very small fraction of the emitted energy returns to the radar. Snow is the weakest reflector, rain a very good reflector, and wet hail the best reflector. The strenght of the reflected energy is measured in decibels of reflectivity, or dBz, and is a measure of the intensity of the precipitation. More about this later.

If the radar's computer knows when the pulse of energy was transmitted and the speed it travels, it can calculate the distance to the reflector by using the time it takes the energy to travel to the precipitation and to return to the radar. By knowing the direction that the radar beam is pointing when the pulse is emitted, it knows the relative direction of the reflector from the radar location. Combining these two pieces of information provides the location of the reflecting precipitation.
To sample the entire atmosphere within the range of the radar, the radar antenna is rotated through all 360 degrees of the compass, and at various elevation angles starting at 0.5 degrees above the horizontal. This provides a 3-dimensional picture of the reflectors above and around the radar location.
The energy returned to the radar is processed by the radar software into three types of data: reflectivity; Doppler velocity; and spectrum width.
Reflectivity is a measure of the energy returned by the atmosphere to the radar. As mentioned above, it is measured in decibels of reflectivity (dBz). It is essentially a measure of the strength of the reflected energy. The stronger is the dBz value, the stronger is the intensity of the precipitation detected by the radar. Radar data typically displayed on the Internet and television/cable is reflectivity from the 0.5 degree elevation scan.
Doppler radars have the ability to detect the change in frequency between emitted and reflected signals. This shift in frequency is due to the motion of the reflecting medium. This change is converted to a Dopplar velocity that measures the movement along the beam. It does not measure motion across the beam. Although Doppler velocity data are availabe on some Internet sites, it is not usually displayed on television/cable.
Spectrum width is a measure of the uncertainity in the velocity measurements and will not be discussed here. It is not routinely available on the Internet or television/cable.
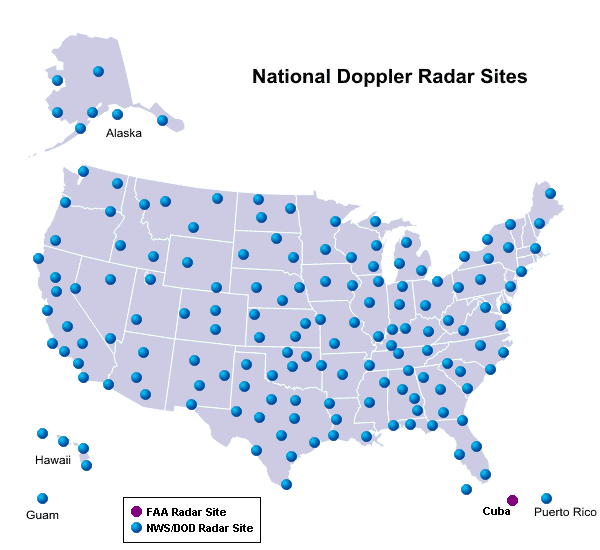
There are two sources of radar data in the United States: the National Weather Service (NWS) (an agency of the U.S. government); and local radars operated by TV stations. The National Weather Service operates a nationwide network of 10-cm Doppler radars. These radars are placed to maximize Doppler velocity coverage over large population centers. The Figure 2 below shows the location of these site. Data from these sites are available on the Internet from NWS web sites such as:
Some, but not many, local television stations operate their own radar. Many of these radars are 5 cm systems. Most television stations use data from the NWS National Radar Network that has been processed or "enhanced" by a private company. These companies specialize in modifying data from the NWS network for use on television/cable and the Internet.
Internet and television/cable radar data displays take one of two forms: a circular area around a radar site or as a regional/national composite.
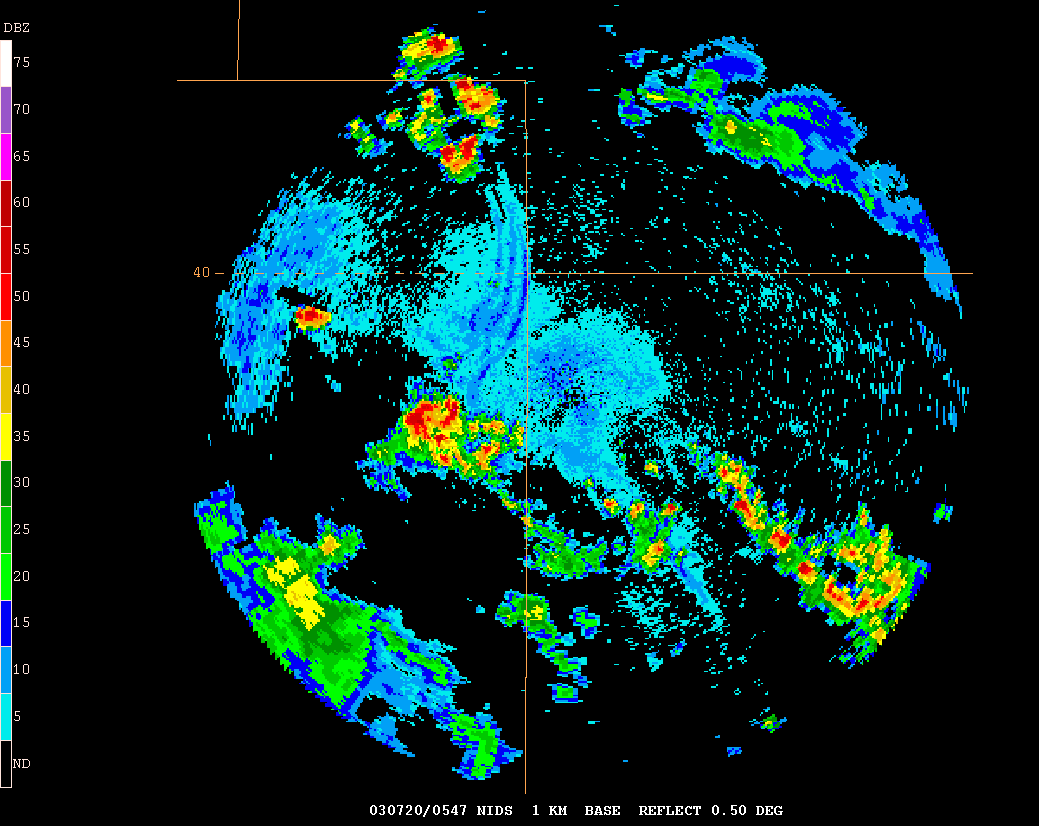
One Site Display: As a radar rotates it gathers information out to 250 miles. As a result radar data for one site covers a circular area centered on the radar location. Although most digital images are rectangular, the circular data area is easily seen on radar displays for one site. Figure 3 shows an example of a radar display from the Goodland, Kansas, radar. The circular limit of the radar data can be seen near the edge of the figure.
Composite Display: A regional or national radar display covering a large geogrpahical area is a combination of data from multiple NWS Radar Network sites. When data from adjacent sites overlap as shown in Figure 4, a computer algorithm is used to determine what to display in the purple overlap area. An algorithm is a series of logical decisions or equations that process data to produce an output value. All regional and national radar displays found on the Internet or television/cable are based on NWS Radar Network data.
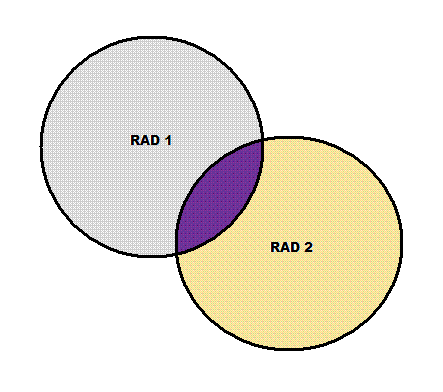
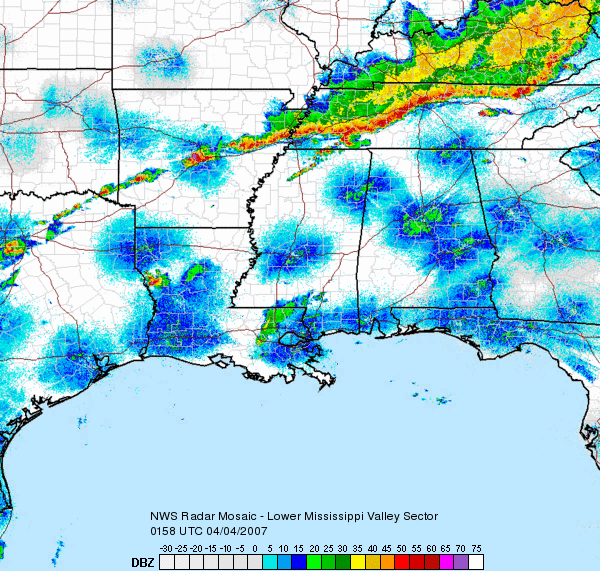
Figure 5 shows an example of a composite produced by the National Weather Service for the southeastern United States. Private companies that produce displays for television/cable produce similar regional and national composites.
Basic radar data are "enhanced" to improve the interpretation of these data and for display purposes. There are two types of enhancements: color enhancement and precipitation enhancement.
Color Enhancement: Radar data are digital information. This property is easily seen by enlarging a radar image (Figure 6) and noting the small rectangular areas of one color. These areas are called sample volumes. They have one numerical value and represent the average reflected radar energy in that small area.
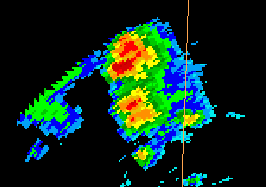
The common way to display digital images is to associate specific colors with a specific range of digital values. This process makes interpretation of the image easier. The question that needs answering is what values to associate with what colors. Because data are digital, the computer can use any combination of colors and image values. Typically "hot" colors are used for higher values while "cool" colors are used for lower values.
The color bars shown at the left side of Figure 3 and at the bottom of Figure 5 are the standard National Weather Service color scale. All NWS radar products use the same color coding. For example, red represents 50 dBz reflectivity or higher, which means thunderstorms. Blue starts at 15 dBz which is considered the lower limit associated with liquid precipitation falling to the Earth's surface.
The digital nature of these data means that each sample volume has a numerical value that can be color-coded by a computer as the radar operator wishes. The implication of this option is that unless a color bar is included with a radar image, it is very difficult to determine the reflectivity values of what is being shown. Color bars are often absent from Internet and television/cable radar displays. The bottom line is: All radar displays are not created equal. Just because a television/cable radar display shows the color red, does not mean it is a thunderstorm. This is only guaranteed for NWS radar displays.
Precipitation Enhancement: Many television/cable radar displays show whether the precipitation is rain, snow or some mixture. NWS radar displays do not. Basic radar data do not indicate precipitation type, only reflectivity. The modification of the basic data to display precipitation type is another algorithm. Details of these algorithms are not common knowledge, but they likely combine basic radar data with surface observations and computer forecast model precipitation type forecasts to show the likely precipitation type. It should be remembered that this type of display is an educated guess at precipitation type and not an observation. During the winter some radar displays show precipitation type and some do not. When viewing a radar display, be aware of this.
Although a thorough discussion of radar interpretation is beyond the scope of this web page, there are a couple of things that can be described.
Intensity: The higher the reflectivity detected by the radar, the stronger is the intensity of the precipitation. The following table lists the dBz values and their corresponding intrepretation:
| dBz Value | Interpretation |
| < 15 | clouds |
| 15-20 | light steady rain |
| 30-40 | showers or heavier rain |
| > 50 | thunderstorms |
Showers versus Rain: Pattern recognition is a big part of radar interpretation. For example, showers and thunderstorms tend to be relatively small, quasi-circular areas, 10 to 30 miles across, of relatively high dBz value. The cluster just to the left of center in Figure 3 and the cluster in Figure 6 are examples of thunderstorms.
Rain is more widespread and fairly uniform in intensity. There are some occasions when showers and thunderstorms are embedded within a wider area of rain. Figure 5 has a broad area of moderate rain over Kentucky while a line of thunderstorms extends along the south edge of the precipitation area.
Rotation and other Algorithms: The National Weather Service radar system employs dozens of algorithms to process the three types of data noted earlier into useful information. These algorithms cover a wide variety of features from storm tracking, to storm rotation, to one- and three-hour precipitation estimates. A lot of these algorithms are used in determining whether severe weather is present and serve as the basis for severe thunderstorm and tornado warnings issued by the National Weather Service. The details of these algorithms is beyond the scope of this web page.
This web page has described some basic properties of radar displays. It is not intended as a complete or thorough thesis on operational radar usage, but hopefully provides some basic information for the non-meteorologist. More detailed information on radar can be found in the Chapter 8 of the ebook found on this web site or in the reference below.
Rinehart, Ronald E., 2004: Radar for Meteorologists, 4th edition. Rinehart Publications, 482 pp.