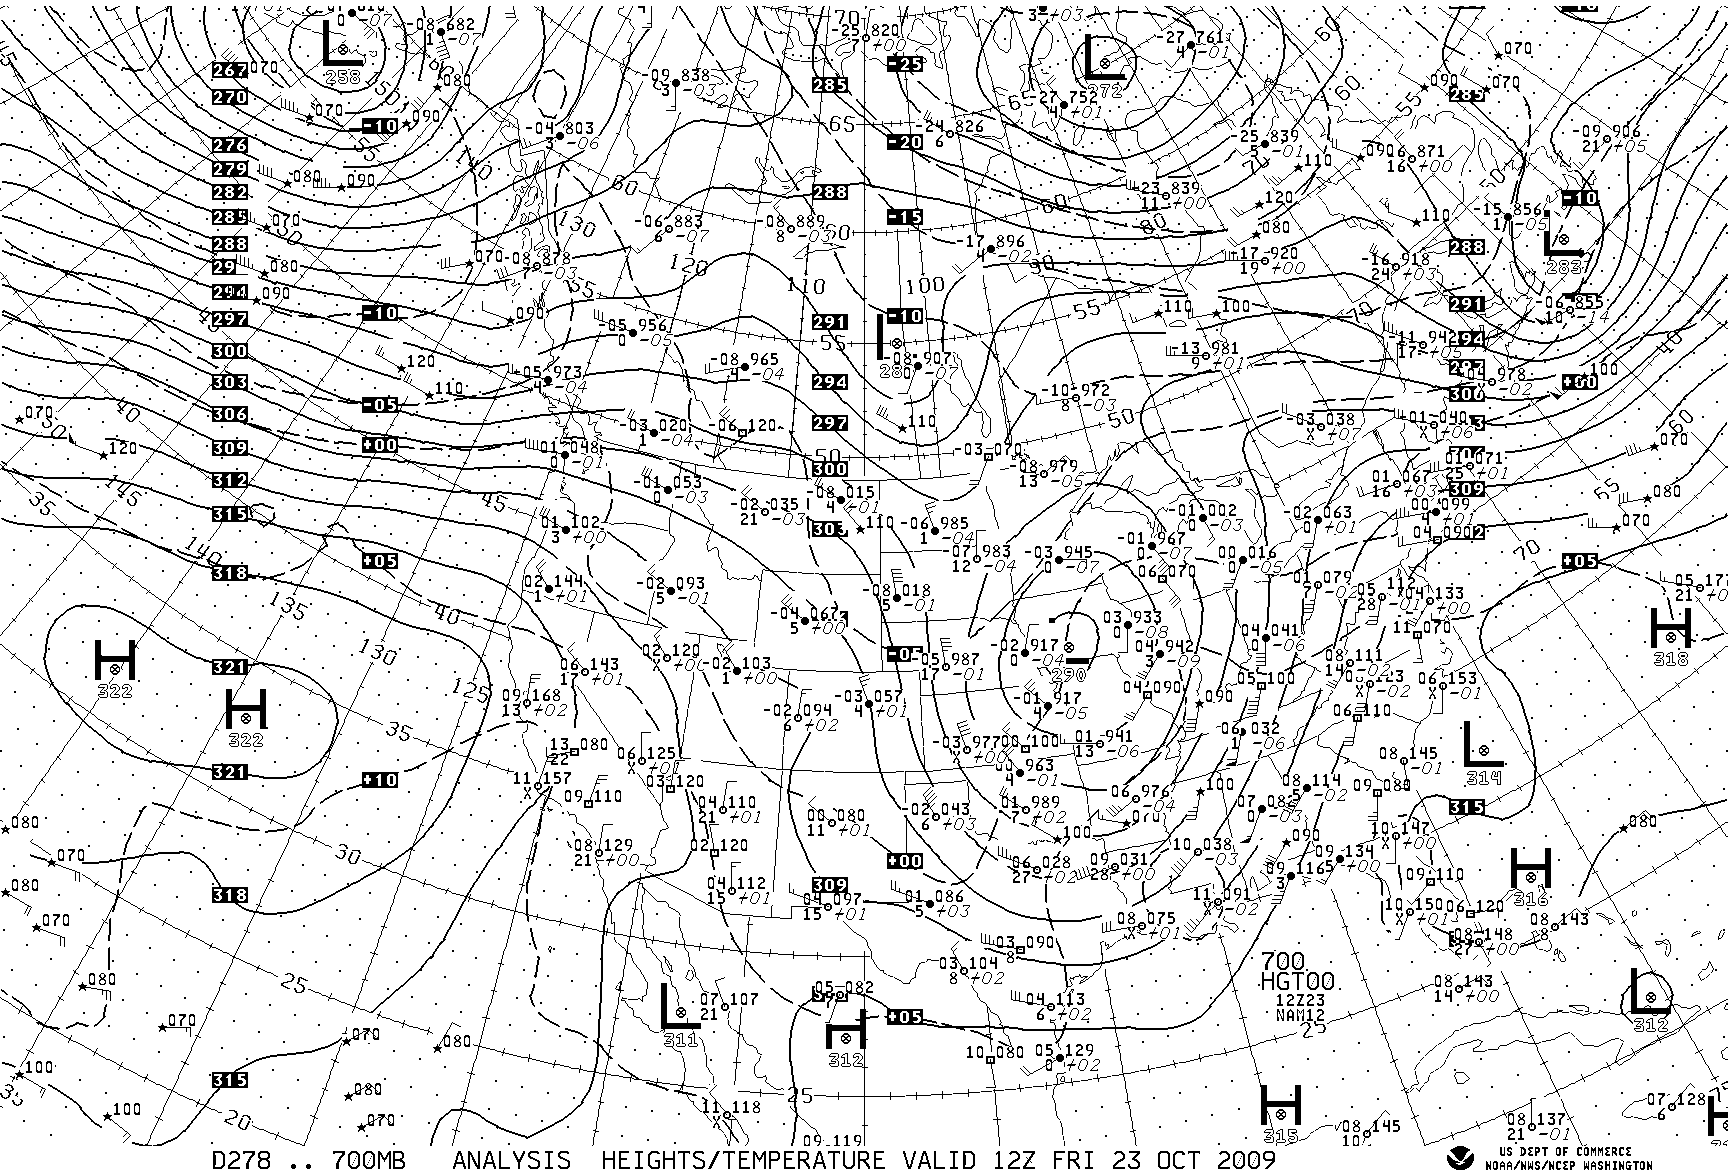
700 mb Chart for 12 UTC on 23 October 2009
Exercise Objective: The purpose of this exercise is to identify areas of cold and warm air advection on 700 mb and 850 mb charts.
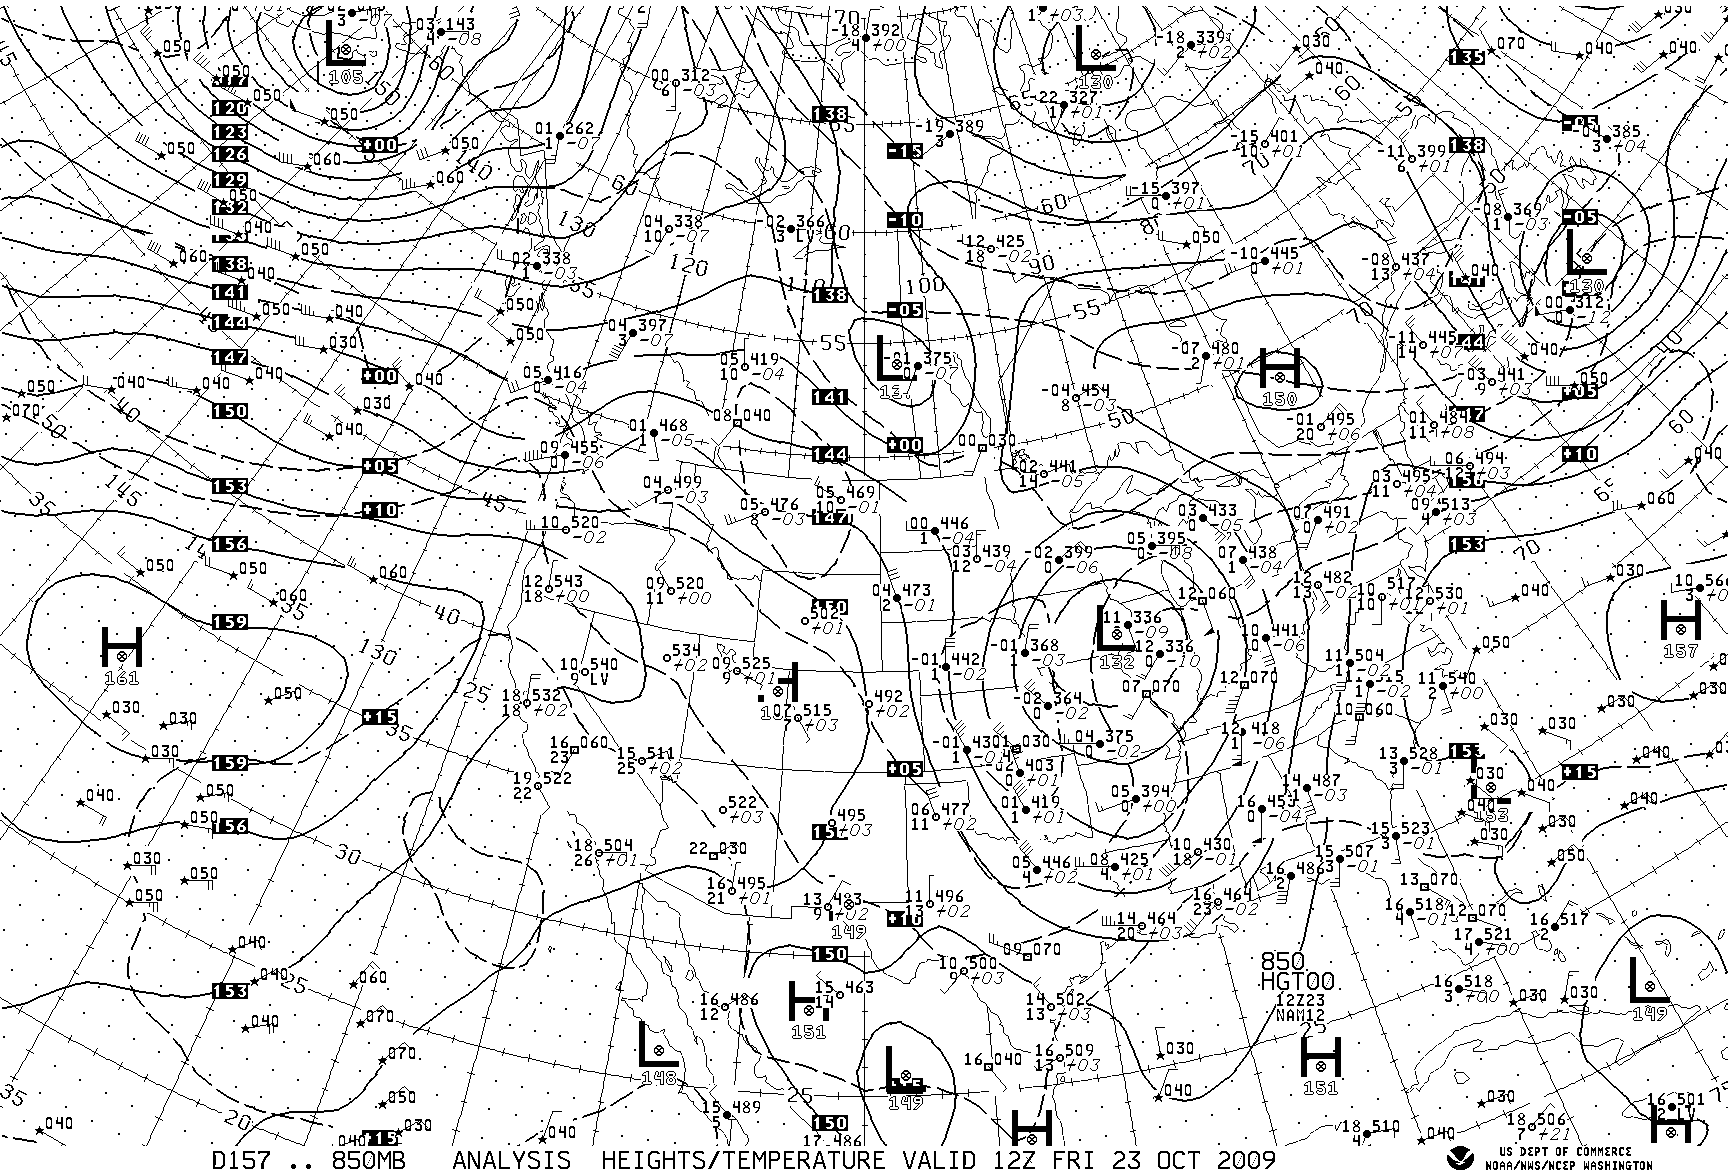
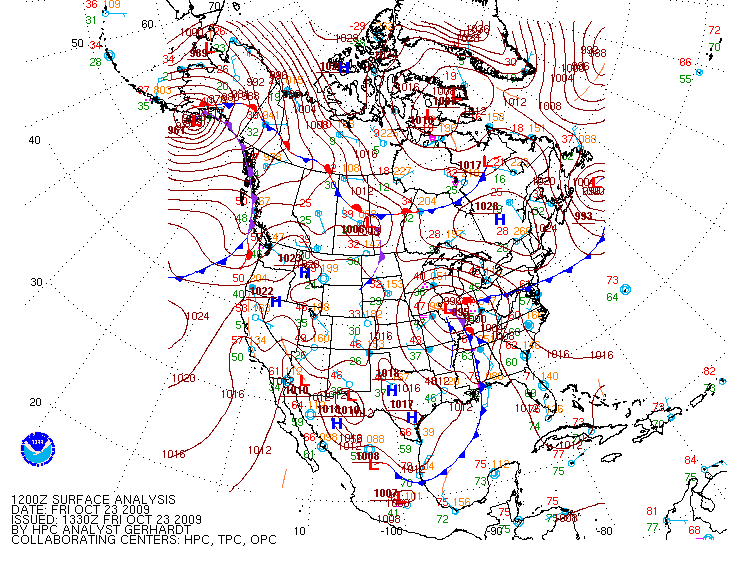
Shown below are the 700 mb and 850 mb charts for 12 UTC on 23 October 2009. The corresponding surface chart is also provided. On the 700 mb and 850 mb charts outline the areas of cold air advection (CAA) and warm air advection (WAA) associated with the strong low center over the lower Missouri River Valley based on the actual winds. Can you find other areas of advection on these charts?
It is suggested that you copy the 700 mb and 850 mb charts to your computer and then print them. This will allow easier analysis of these charts.


